Summary of Chapter
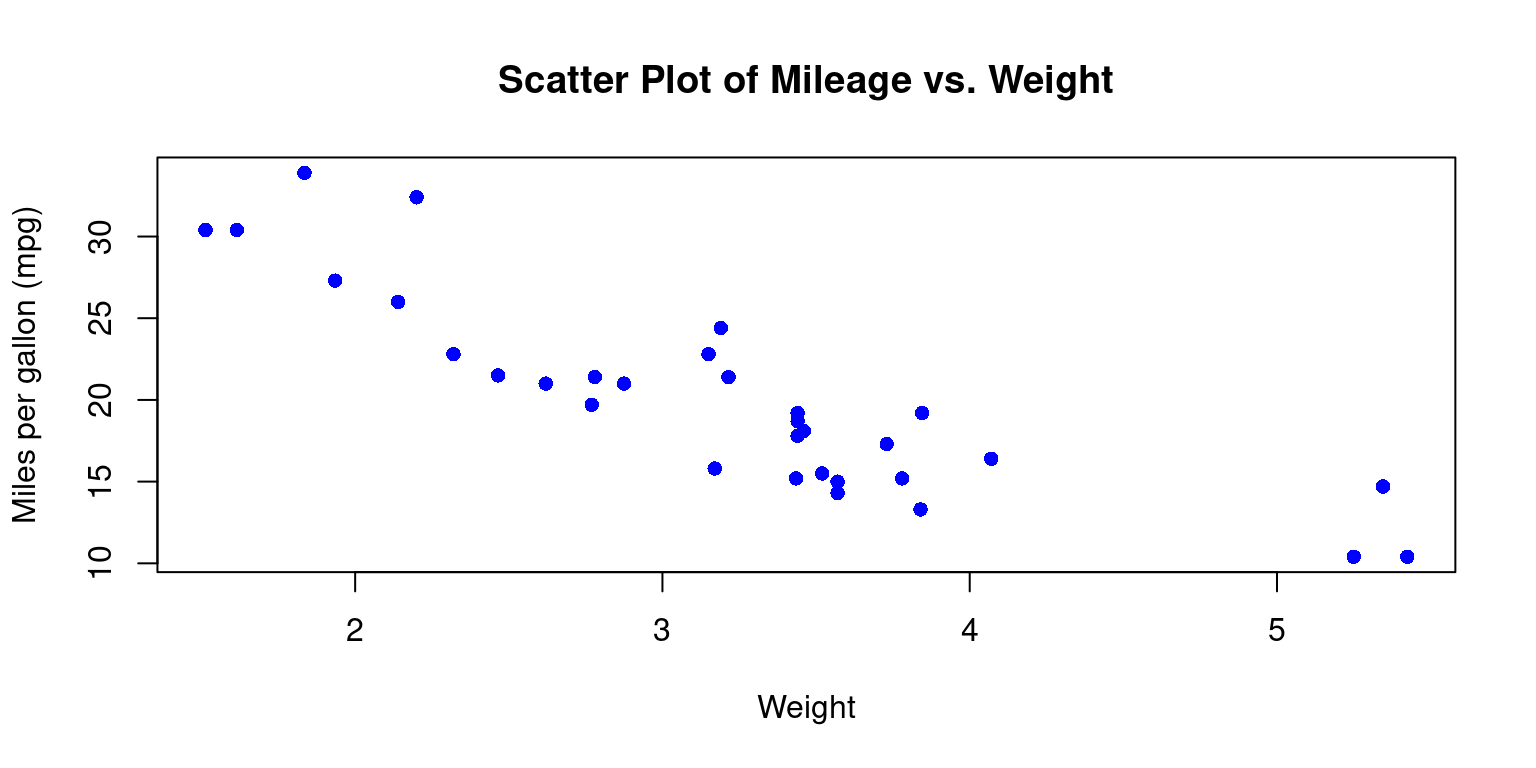
In this chapter, we explore the analysis of relationships between continuous variables. We begin by preparing a sample dataset and converting it to a structured format. As we move forward, we emphasize the importance of visual tools like scatter plots for understanding correlations and patterns between variables. These visual tools can reveal underlying trends, groupings, anomalies, and influential data points.
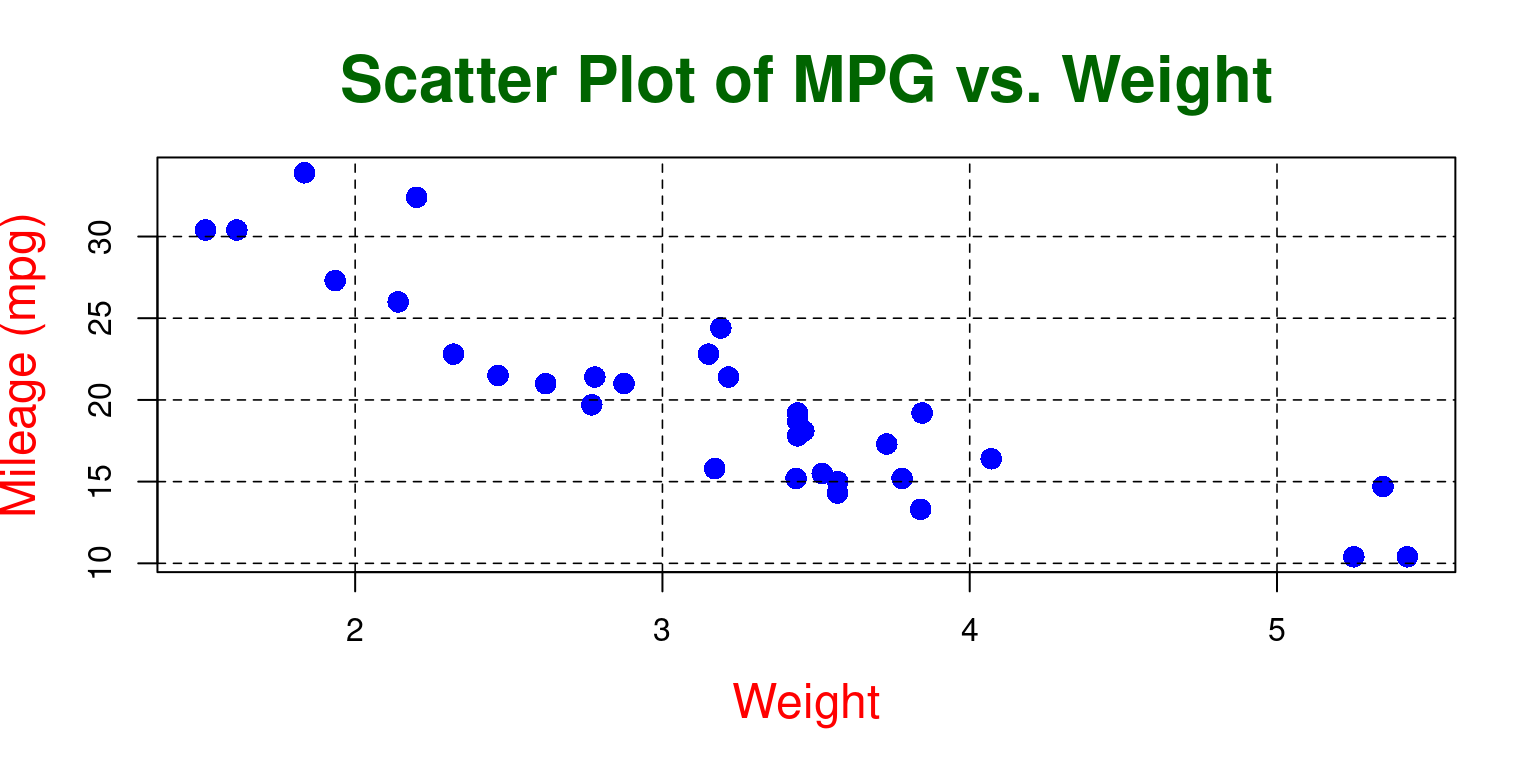
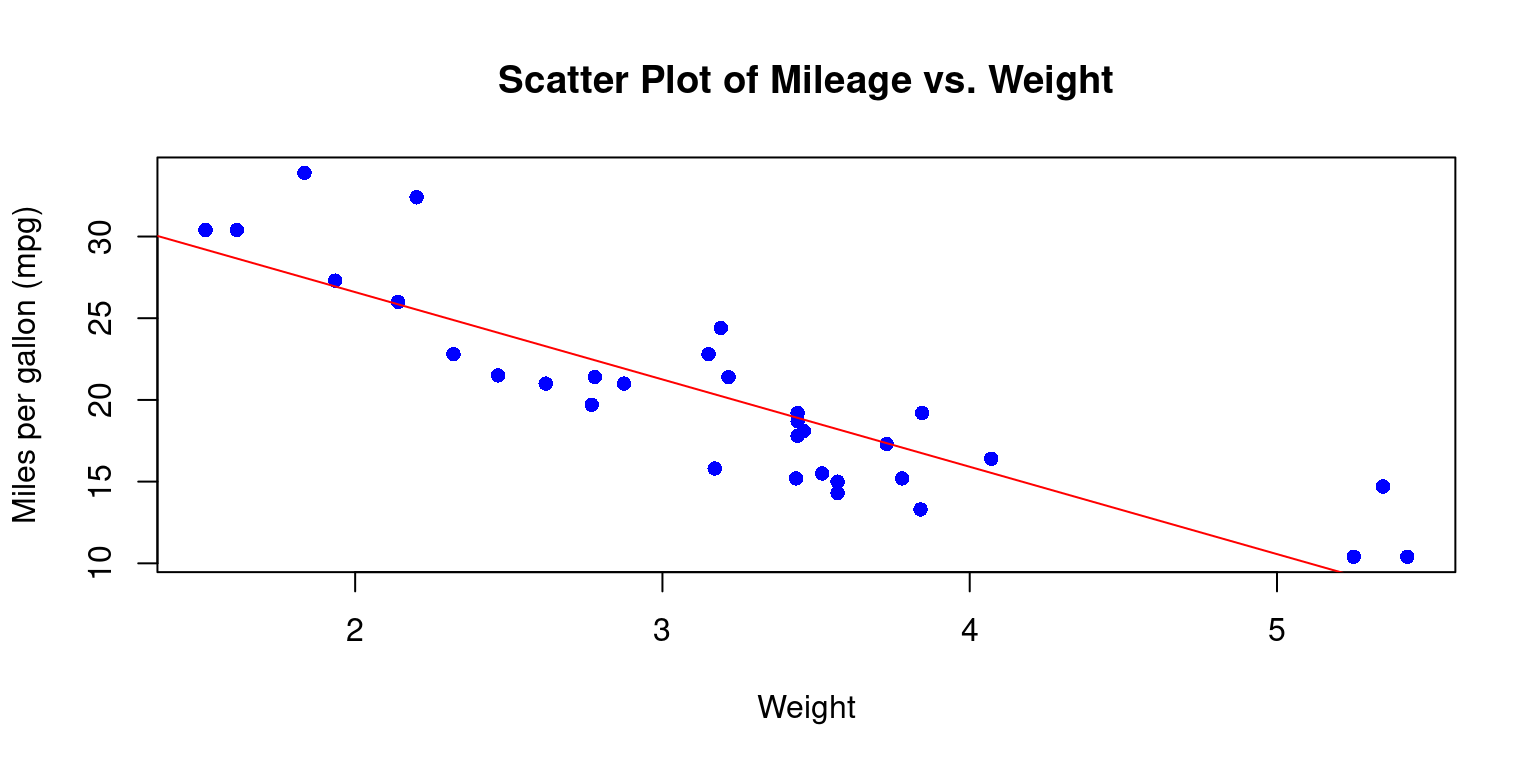
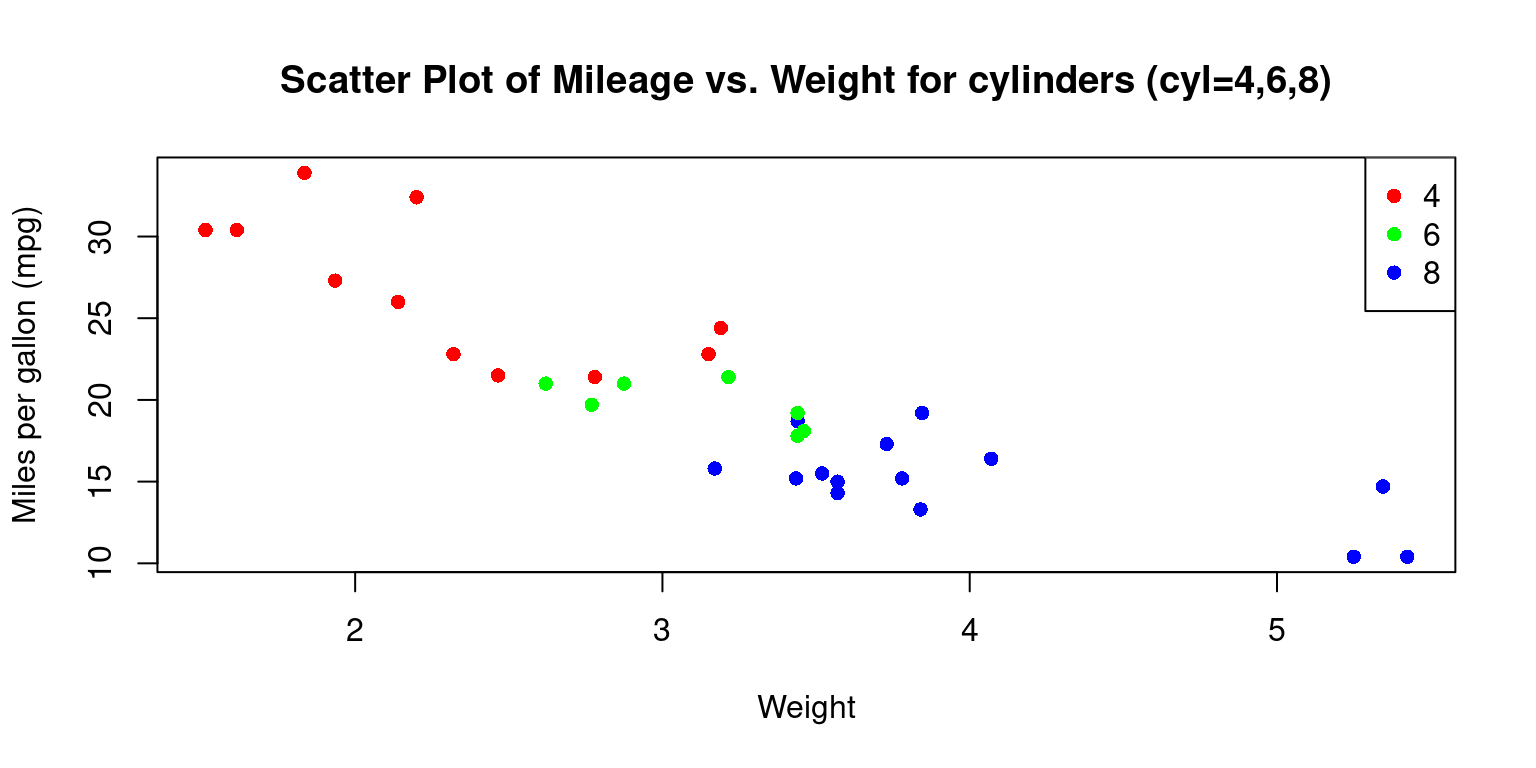
Using practical examples, we demonstrate how to create and customize these visualizations for clearer insights. Additionally, we introduce methods for enhancing scatter plots, including adding trend lines. The chapter also touches on the visualization of interactions between multiple variables, including the integration of categorical data, by means of color differentiation.
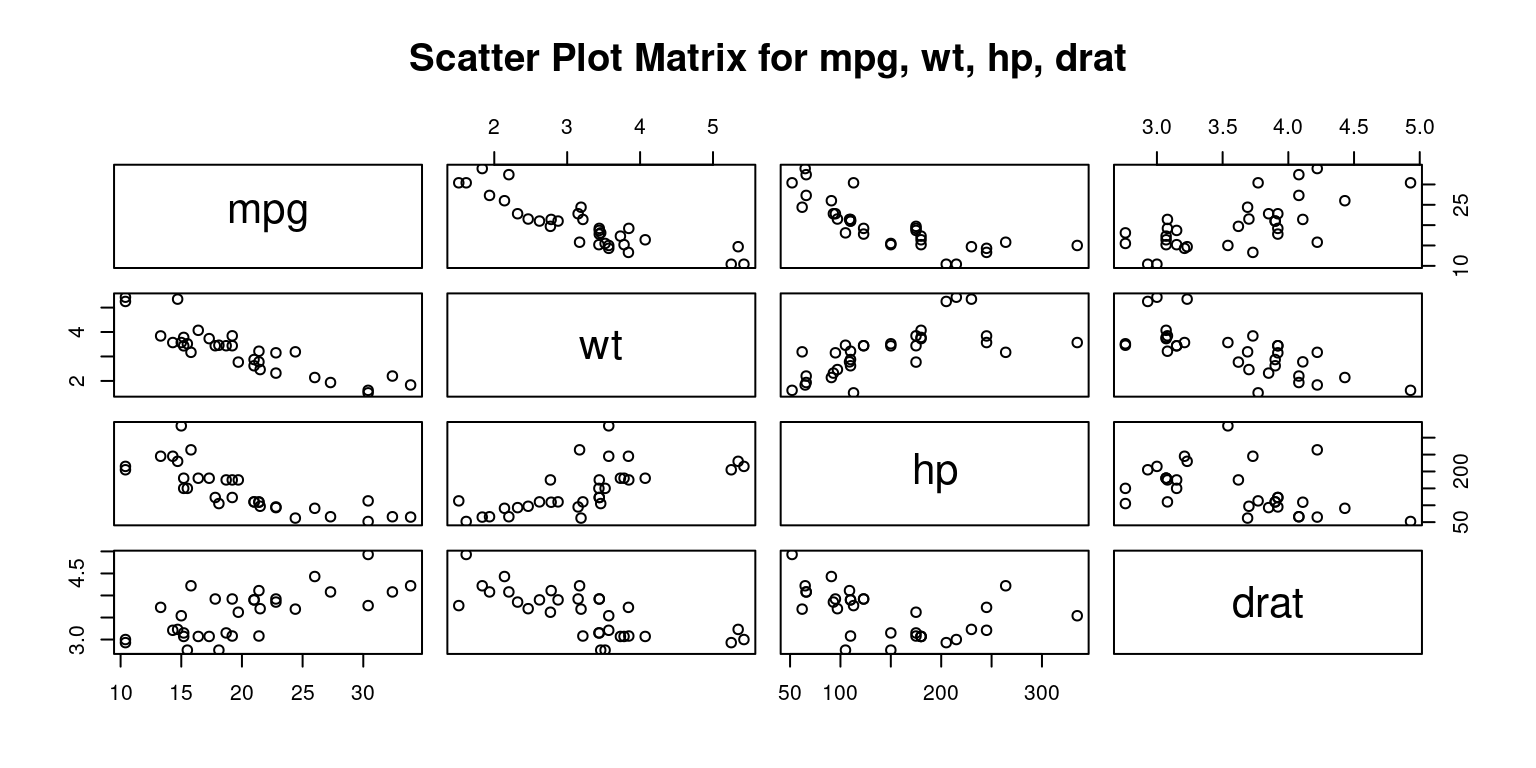
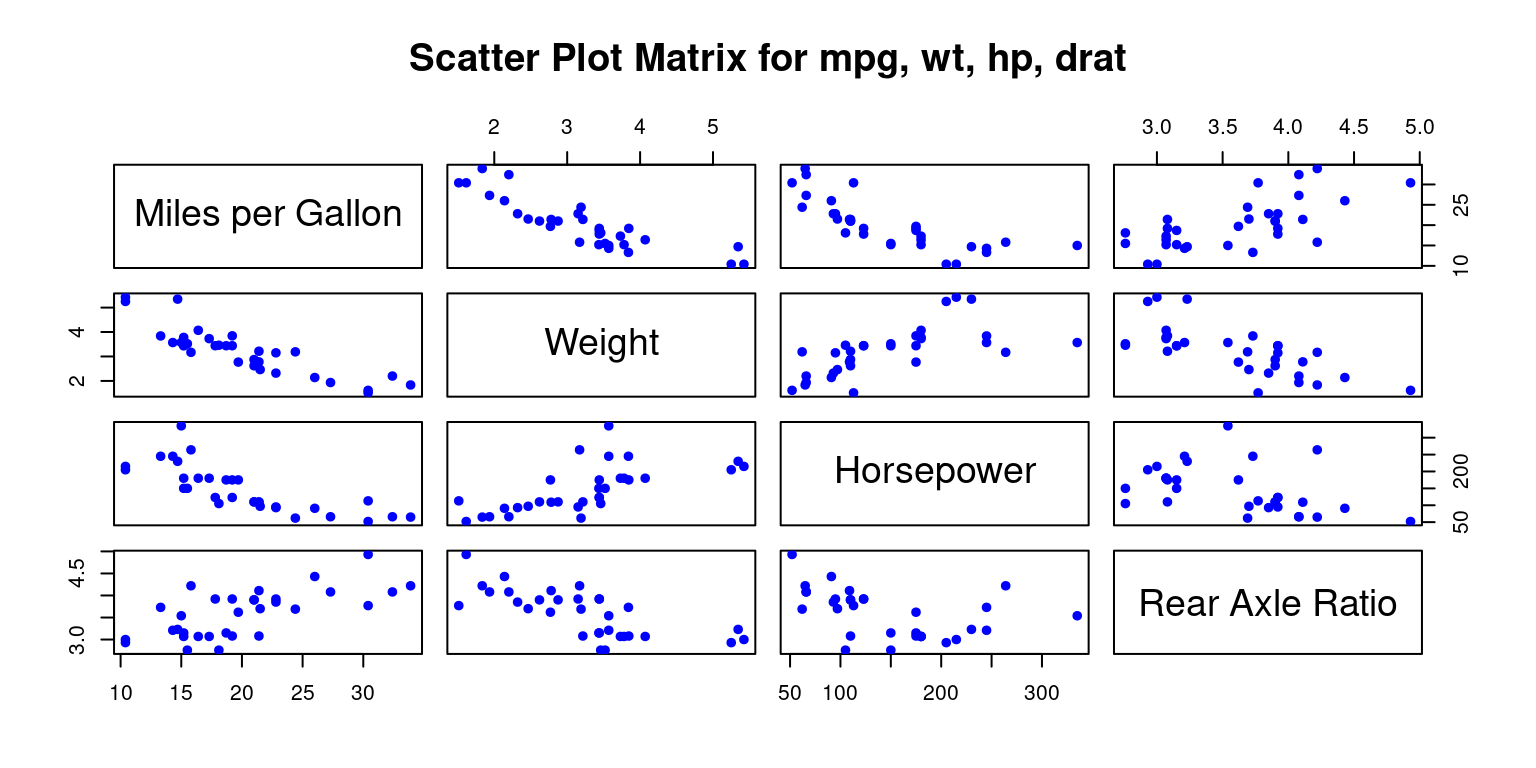
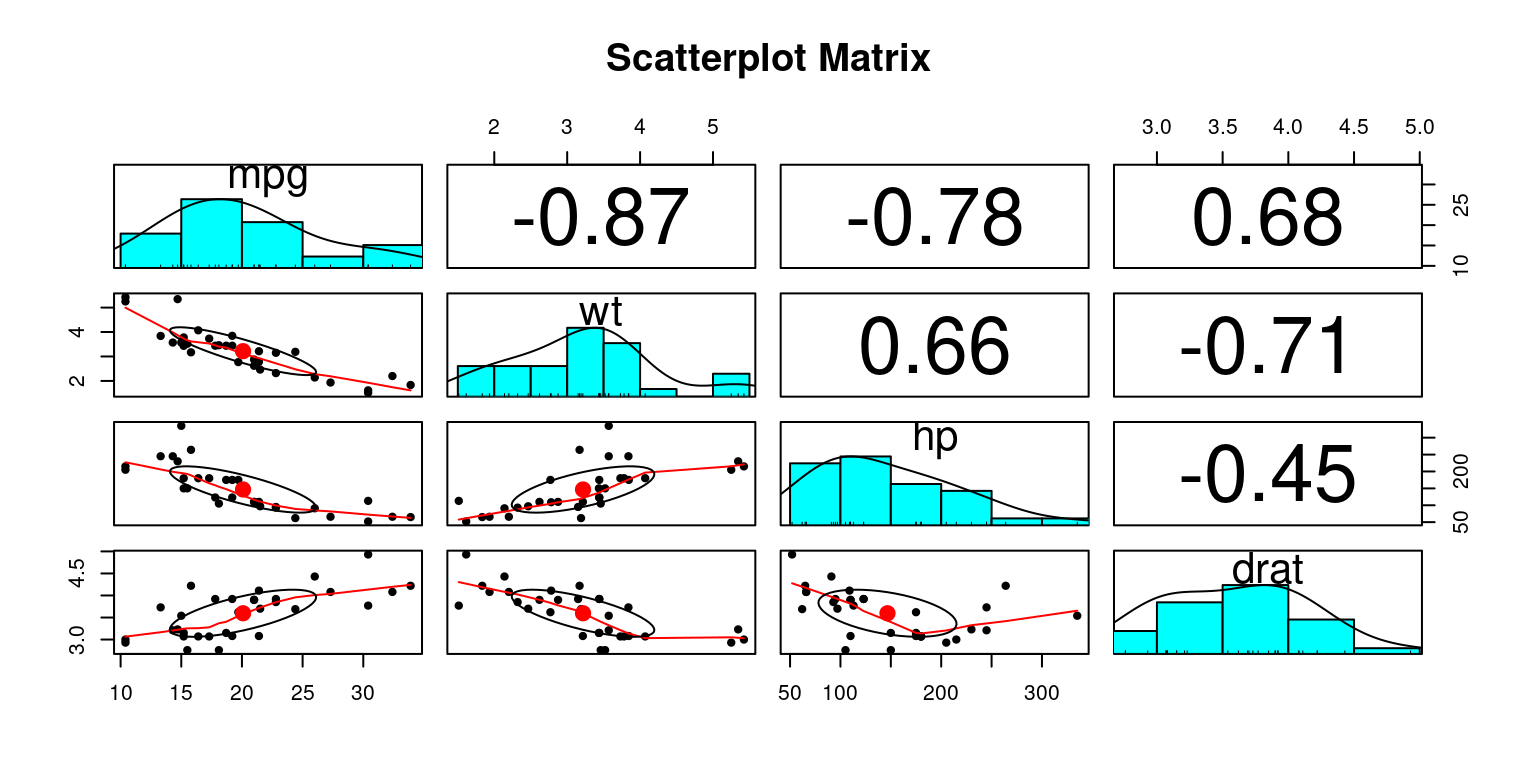
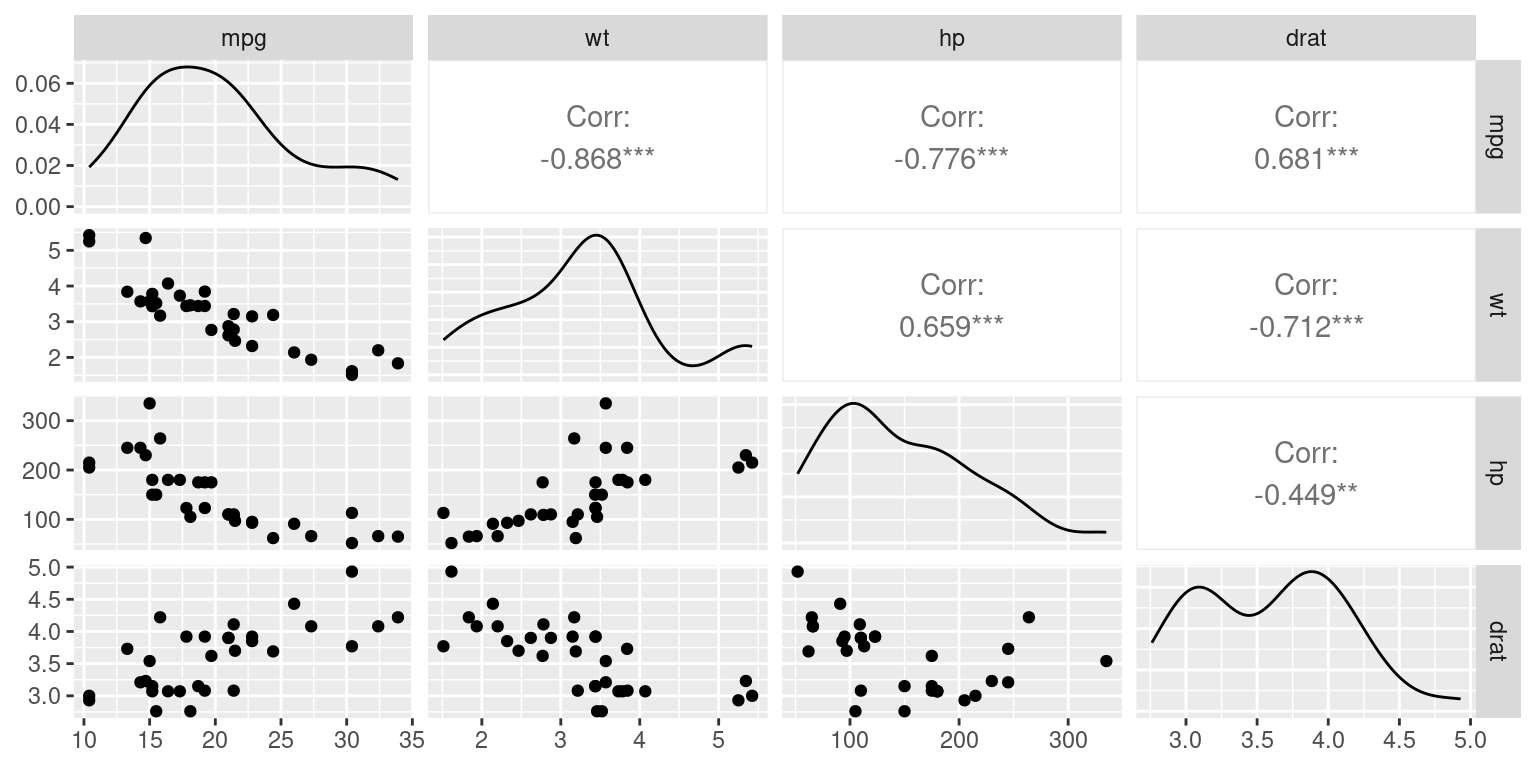
Transitioning from scatter plots, we explore the concept of a scatter plot matrix, or SPLOM. This tool is instrumental in showcasing pairwise relationships between a set of variables in a matrix format. Scatter plot matrices are incredibly helpful when navigating multivariate datasets, allowing quick visual recognition of potential correlations and relationships among variable pairs.
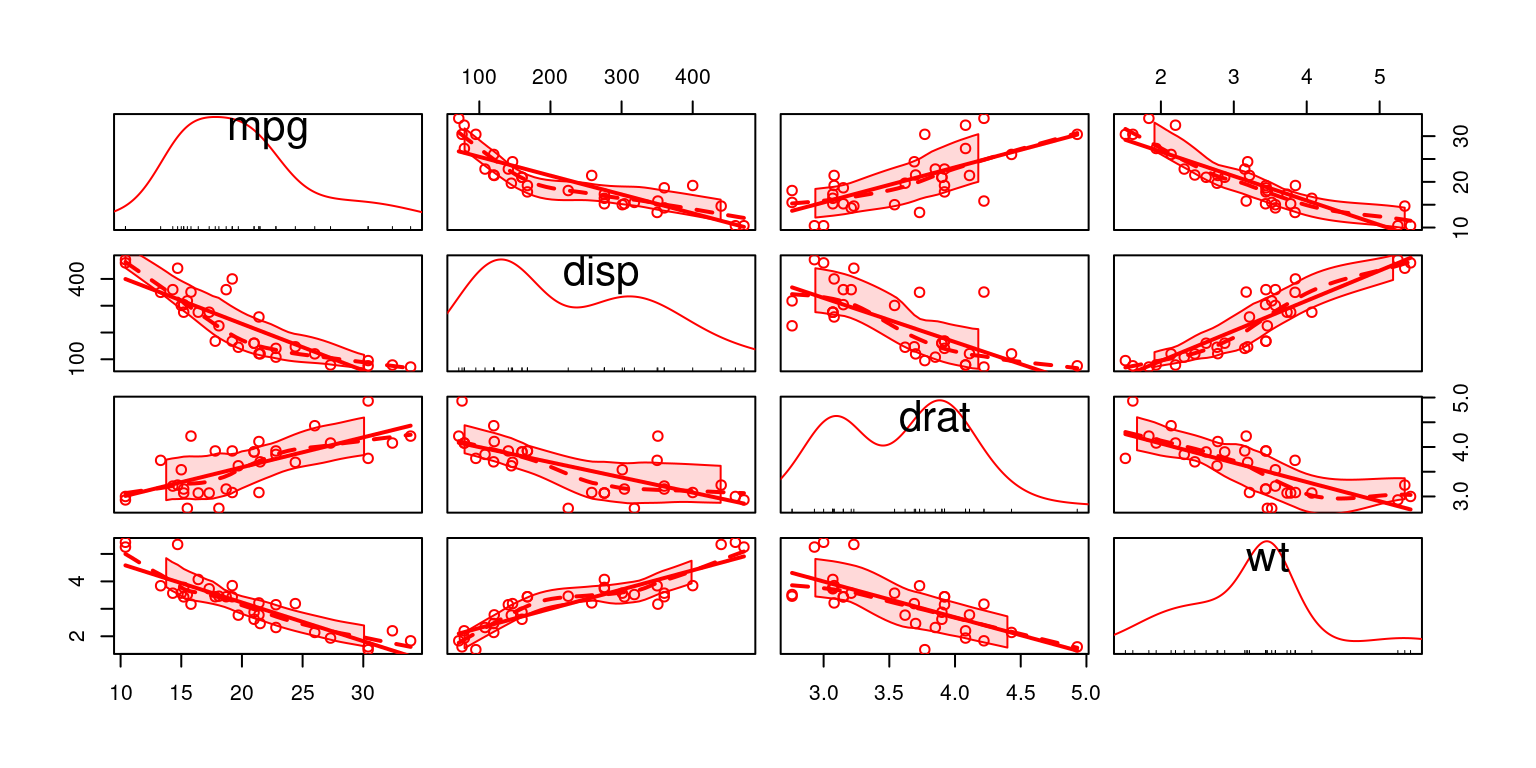
We then demonstrate how to create scatter plot matrices using R functions like pairs(), scatterplotMatrix(), and pairs.panels(). Each method offers a different visual experience and comes with its unique set of features. For example, using pairs.panels() from the psych package, the matrix not only contains scatter plots but also histograms on the diagonal, correlation coefficients, and other enlightening statistical visualizations.
Overall, this chapter equips us with the knowledge to visualize and analyze bivariate continuous data effectively, aiding in more profound data interpretation and insights.
References
[1] Everitt, B. S., & Hothorn, T. (2014). A Handbook of Statistical Analyses Using R. Chapman and Hall/CRC.
[2] R Core Team. (2023). R: A language and environment for statistical computing. R Foundation for Statistical Computing. https://www.R-project.org/
[3] Fox, J., & Weisberg, S. (2019). An R Companion to Applied Regression (3rd ed.). Sage Publications.
[4] Everitt, B., & Hothorn, T. (2011). An introduction to applied multivariate analysis with R. Springer.
[5] Chick, J. (2020). Data visualisation with R: 100 Examples. CRC Press.
[6] Revelle, W. (2020). Procedures for personality and psychological research. Northwestern University, Evanston. Retrieved from https://CRAN.R-project.org/package=psych.